Guide for Multilayered Corridor Design Tool
A multilayered air corridor is a design concept for organizing the airspace in a way that allows for high efficiency and zero collisions.1
The airspace is divided into layers, with the top layer accommodating southbound and northbound traffic, and the bottom layer accommodating eastbound and westbound traffic. At intersections, there is also a middle layer which is used by the vehicles for hovering when changing directions. Each layer is represented by its floor and ceiling altitudes. The concept of a multilayered air corridor is part of the proposed model for designing air corridors in our ANT City Software Platform for AAM.
Here below are the constituent building blocks for Air Corridors, including air cubes, skylanes, intersections, vertiports, and gates.
Skylane Design
A skylane is a 3D volume of airspace reserved for unmanned aerial systems (UASs) and is divided into two layers throughout the airspace except for intersections12.
The (UAVs) fly in a specific direction. The top layer accommodates southbound and northbound traffic, whereas the bottom layer accommodates eastbound and westbound traffic.
At intersections, there is also a middle layer which is used by the vehicles for hovering when changing directions.
The skylane is divided into air cubes, and each cube is represented by a set of variables that define its position and orientation. The skylane also includes intersections, vertiports, and gates, which regulate the movement of vehicles inside the skylane.
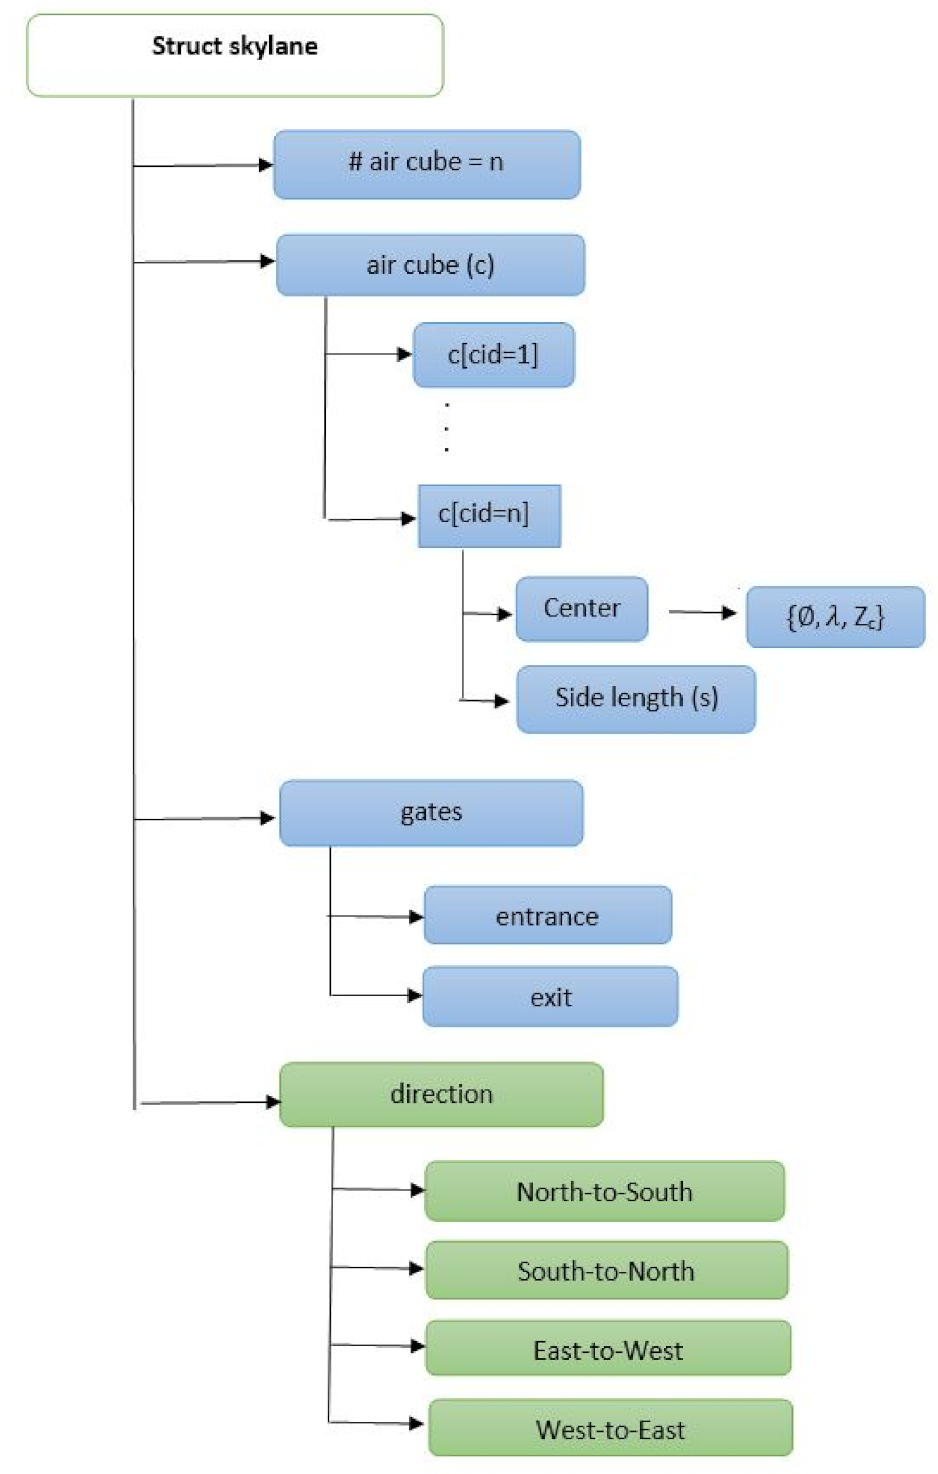
In the figure above, Blue boxes represent variables that define the data elements of skylane. Green boxes represent variables that define movement directions of vehicles inside the skylane.1
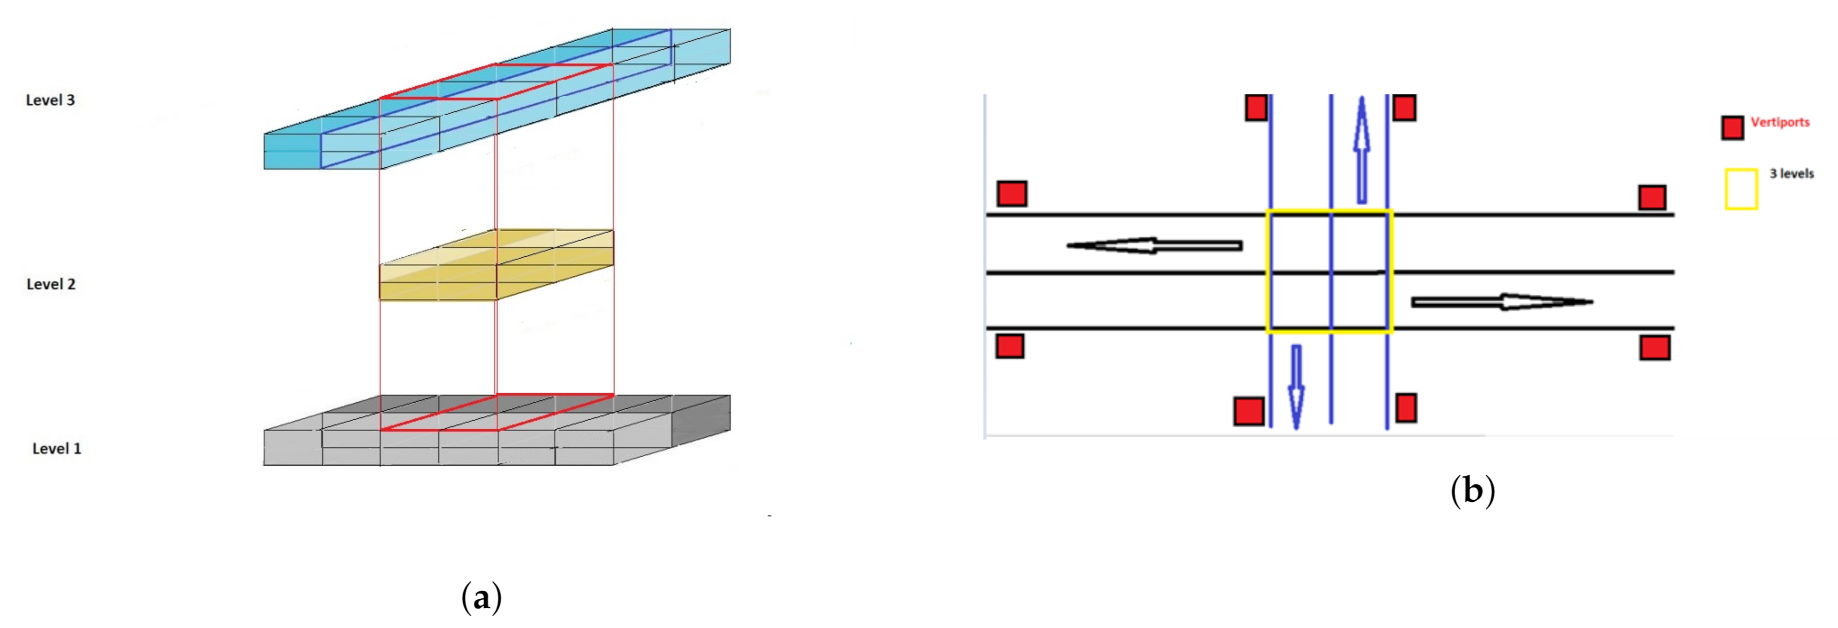
(a) Side view of an intersection. (b) Top view of an intersection: skylanes in level 1 (East-to-West) are in black color, skylanes in level 3 (North-to-South) are in blue color, and red boxes represent vertiports.
Skylane Input Data
| Variable Name | Type | Format | Units | Range | Description |
|---|---|---|---|---|---|
| Latitude | Numeric Box | #.###0 | degrees |
min: -90 max: 90 | Latitude of the skylane home location |
| Longitude | Numeric Box | #.###0 | degrees |
min: -180 max: 180 | Longitude of the skylane home location |
| Skylane Length | Numeric Box | #.## | km - [mi] (mi) |
min: 0.1 | Length of the skylane |
| Air Cube Side Length | Numeric Box | #.## | m - [ft] |
min: 10 | Side length of the air cube |
| Minimum Gap Between UAVs | Numeric Box | # | cubes | min: 1 | Minimum gap between UAVs in terms of number of cubes |
| Maximum Ceiling Altitude | Numeric Box | # | m - [ft] |
min: 100 | Maximum altitude for the skylane |
| Number of Air Cubes | Numeric Box | # | - | min: 1 | Number of air cubes in the skylane |
| Number of Gates | Numeric Box | # | - | min: 1 | Number of gates in the skylane |
| Number of Vertiports | Numeric Box | # | - | min: 1 | Number of vertiports in the skylane |
Geofence Design
Geofence is a virtual boundary that defines a volume of airspace where UAVs are allowed to fly. It is defined by a minimum floor altitude, maximum ceiling altitude, and a list of horizontal vertices. The volume is defined relative to the set of home locations, where each home location is represented by a pair of latitude and longitude coordinates. The altitude of the home location above mean sea level (MSL) is represented by h_i, and the activation time for home location i for geofence g is represented by z_f and z_c.
It is used to describe virtual three-dimensional "boundaries" that each UAS flies within or avoids as a no-fly zone (NFZ). Skylanes and geofences are different types of aerial corridors.
Geofence Input Data
| Variable Name | Type | Format | Units | Range | Description |
|---|---|---|---|---|---|
| Geofence Type | Combo Box | - | - | Static, Dynamic | Type of geofence |
| Geofence Name | Text Box | - | - | - | Name of the geofence |
| Home Location | Combo Box | - | - | - | List of home locations |
| Geofence Floor | Numeric Box | # | m - [ft] |
min: 0 | Floor altitude of the geofence |
| Geofence Ceiling | Numeric Box | # | m - [ft] |
min: 0 | Ceiling altitude of the geofence |
| Number of Vertices | Numeric Box | # | - | min: 3 | Number of vertices for the geofence |
| Vertex Coordinates | List | (lat, long) | degrees |
- | List of vertices for the geofence |
Intersection Design
An Air Corridor intersection is the junction where one skylane crosses another in the horizontal plane. It is the place where vehicles turn or change their direction. To design an Air Corridor intersection, we must consider the following:
- Safety: The intersection should be designed to avoid collisions. It should include three layers, with the middle layer used for temporary hovering before a UAV actually makes the intended turn.
- Traffic management: The intersection should be designed to handle traffic in different directions. Strategies for handling traffic at intersections will be developed.
- Capacity: The capacity of the intersection should be considered in terms of the number of UAVs that can pass through it and the estimated travel time.
- Location distribution of vehicles: The probability density function of the vehicle locations in a skylane should be considered to ensure that the distribution of vehicle locations remains uniform despite variations in traffic volumes or vehicle speeds.
- Mobility model: The mobility model of the vehicles should be considered to ensure that the vehicles move in a predictable manner.
- Probability of collision: The probability of collision in a skylane should be considered to ensure that the intersection is safe for UAVs to pass through.
Intersection Input Data
| Variable Name | Type | Format | Units | Range | Description |
|---|---|---|---|---|---|
| Intersection Dimensions | Textbox | L x W x H | m - [ft] |
- | Length, width, and height of the intersection |
| Intersection Floor and Ceiling Altitudes | Textbox | #.# | m - [ft] |
- | Minimum and maximum altitudes of the intersection |
| Intersection Capacity | Textbox | # | - | min: 1 | Maximum number of UAVs that can be in the intersection at once |
| Intersection Traffic Management | Combobox | - | - | Round-robin, priority-based, first-come-first-served | Method used to manage traffic at the intersection |
Vertiport Design
Minimum parameters considered for take-off and landing areas. For detailed information about Vertiport Design and more detailed parameters, refer to:
Vertiport Minimum Input Data
| Variable Name | Type | Format | Units | Range | Description |
|---|---|---|---|---|---|
| Vertiport Name | Textbox | - | - | - | Name of the vertiport |
| Vertiport Location | Textbox | - | - | - | Location of the vertiport |
| Vertiport Dimensions | Textbox | L x W x H | m - [ft] |
- | Length, width, and height of the vertiport |
| Vertiport Floor and Ceiling Altitudes | Textbox | #.# | m - [ft] |
- | Minimum and maximum altitudes of the vertiport |
| Vertiport Capacity | Textbox | # | - | min: 1 | Maximum number of UAVs that can land or take off at once |
| Vertiport Traffic Management | Combobox | - | - | Round-robin, priority-based, first-come-first-served | Method used to manage traffic at the vertiport |
Gate Design
Gate (as defined in 1) is a connection between a skylane and a vertiport in an air corridor. It regulates the takeoff and landing operations of the UAVs, and vehicles need to go through the gates to enter or exit the skylanes.
Gate Design Input Data
| Variable Name | Type | Format | Units | Range | Description |
|---|---|---|---|---|---|
| Gate Name | Textbox | - | - | - | Name of the gate |
| Gate Location | Textbox | - | - | - | Location of the gate |
| Gate Dimensions | Textbox | L x W x H | m - [ft] |
- | Length, width, and height of the gate |
| Gate Floor and Ceiling Altitudes | Textbox | #.# | m - [ft] |
- | Minimum and maximum altitudes of the gate |
| Gate Capacity | Textbox | # | - | min: 1 | Maximum number of UAVs that can pass through the gate at once |
| Gate Traffic Management | Combobox | - | - | Round-robin, priority-based, first-come-first-served | Method used to manage traffic at the gate |
Traffic Flow Simulation
This section lists the variables used as inputs to the simulation model, such as Simulation Time, Traffic Volume, Vehicle Velocity, and Collision Probability Threshold. It is important to input accurate and realistic data to ensure the validity of the simulation results.
To calculate the results, basic rules of engagement for vehicles inside the skylane will be used. The rules include restrictions on cube occupancy, overtaking, and direction of movement. The middle layer of the skylane is used for temporary hovering before a UAV makes a turn, and the burden of collision avoidance is placed on the vehicles.
Traffic Flow Input Data
| Variable Name | Type | Format | Units | Range | Description |
|---|---|---|---|---|---|
| Simulation Time | Numeric Box | # | min | min: 1 | Length of simulation time |
| Time Step | Numeric Box | # | s |
min: 1 | Length of time step for simulation |
| Traffic Volume | Numeric Box | # | vh/hour |
min: 1 | Number of vehicles per hour |
| Vehicle Velocity | Numeric Box | #.## | m/s - [ft/s] |
min: 1 | Velocity of vehicles in the skylane |
| Vehicle Acceleration | Numeric Box | #.## | m/s^2 - [ft/s^2] |
min: 0 | Acceleration of vehicles in the skylane |
| Vehicle Deceleration | Numeric Box | #.## | m/s^2 - [ft/s^2] |
min: 0 | Deceleration of vehicles in the skylane |
| Collision Probability Threshold | Numeric Box | #.# | - | min: 0, max: 1 | Threshold for collision probability |
| Probability Density Threshold | Numeric Box | #.# | - | min: 0, max: 1 | Threshold for probability density of vehicle locations |
Simulation and Visualization Outputs
The model will output the following: - A 3D visualization of the designed aerial corridor - Traffic flow simulation results - Collision probability analysis - Probability density of vehicle locations in air corridors - Capacity analysis of the skylanes - Rules of engagement for collision-free traffic inside the corridors
Collision Probability Analysis (Future)
The collision probability is defined as the probability of two or more UAVs occupying the same cube at the same time. The system should estimate and present the probability of no collision as a function of the number of UAVs present in a skylane.
| Variable Name | Type | Format | Units | Range | Description |
|---|---|---|---|---|---|
| Collision Probability | Numeric Box | #.# | - | min: 0, max: 1 | Probability of collision in the skylane |
| Probability Density | Numeric Box | #.# | - | min: 0, max: 1 | Probability density of vehicle locations in the skylane |
| Probability Density Map | Visualization | - | - | - | 2D visualization of probability density map |
| Collision Probability Map | Visualization | - | - | - | 2D visualization of collision probability map |
Capacity Analysis (Future)
The variables in this section are outputs of the simulation model and are used to analyze and visualize in 3D and XR the capacity of the skylane. Capacity is defined as the maximum number of vehicles that can be accommodated in the skylane without causing congestion or collisions. Capacity Utilization is the ratio of actual traffic volume to capacity, and it indicates how efficiently the skylane is being used. Bottleneck Analysis is a visualization that shows the areas of the skylane where traffic congestion is likely to occur, and it can be used to identify areas where improvements can be made to increase capacity.
| Variable Name | Type | Format | Units | Range | Description |
|---|---|---|---|---|---|
| Capacity | Numeric Box | # | vehicles/hour | min: 1 | Maximum number of vehicles that can be accommodated in the skylane |
| Capacity Utilization | Numeric Box | #.# | - | min: 0, max: 1 | Ratio of actual traffic volume to capacity |
| Bottleneck Analysis | Visualization | - | - |
-
Savvy Verma, Vicki Dulchinos, and Wood. Corridor design and analysis for uam operations - nasa technical reports server (ntrs). Sep 2022. URL: https://ntrs.nasa.gov/citations/20220012923. ↩↩↩↩
-
Sabrina Islam Muna, Srijita Mukherjee, Kamesh Namuduri, Marc Compere, Mustafa Ilhan Akbas, Péter Molnár, and Ravichandran Subramanian. Air corridors: concept, design, simulation, and rules of engagement. Sensors, 21(22):7536, Nov 2021. URL: http://dx.doi.org/10.3390/s21227536, doi:10.3390/s21227536. ↩
-
Faa engineering brief no. 105 - vertiport design | federal aviation administration. Sep 2022. URL: https://www.faa.gov/airports/engineering/engineering_briefs/engineering_brief_105_vertiport_design. ↩
-
Prototype technical specifications for the design of vfr vertiports for operation with manned vtol-capable aircraft certified in the enhanced category (pts-vpt-dsn). Mar 2022. URL: https://www.easa.europa.eu/en/document-library/general-publications/prototype-technical-design-specifications-vertiports. ↩